

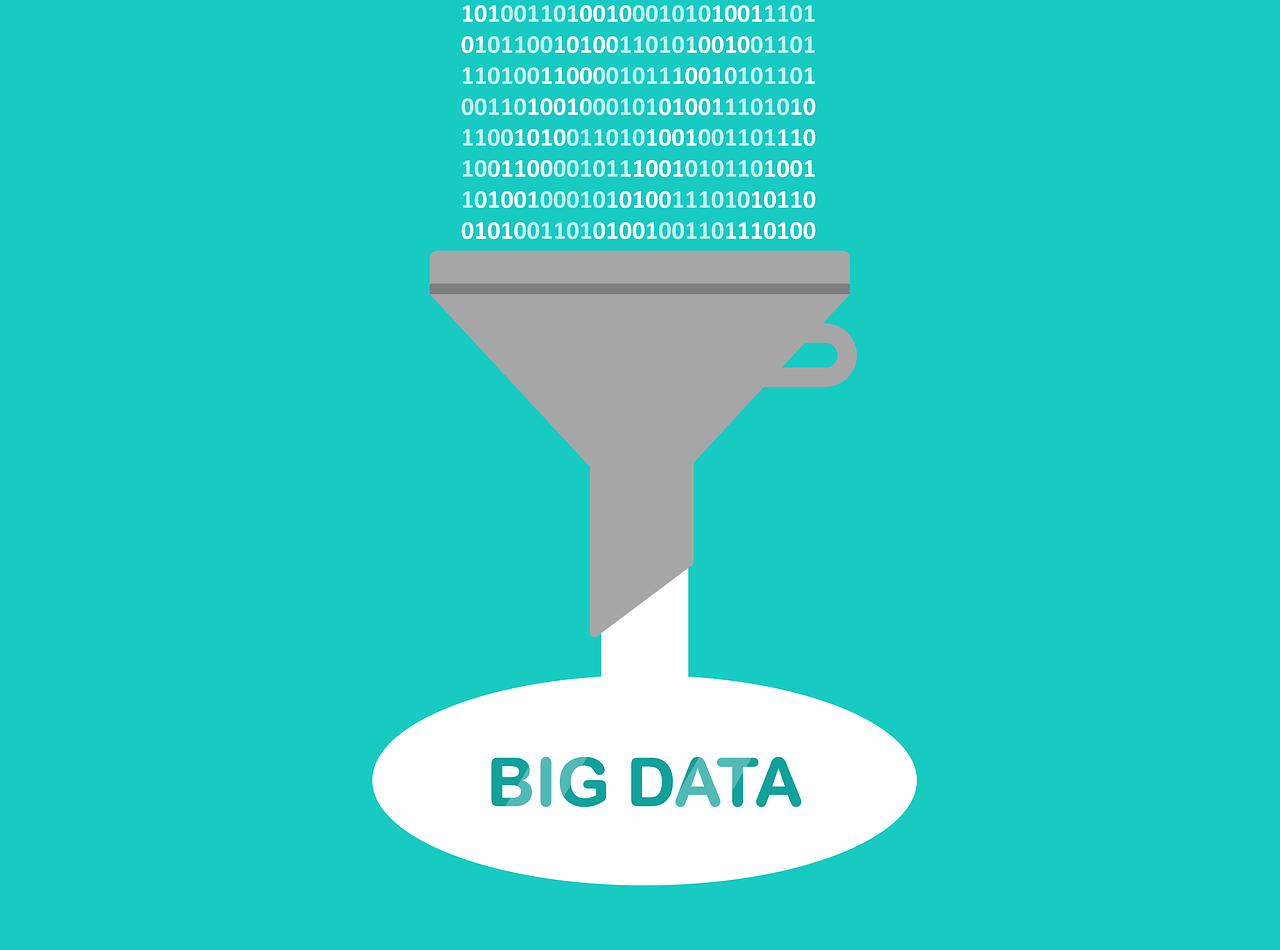
Automation gathers data from multiple sources in real-time, eliminating manual effort and reducing errors.
Example: A market research firm uses automation to pull survey responses and social media analytics into a central dashboard, saving hours of manual work.
Automated tools monitor competitor pricing, promotions, and activity, providing actionable insights.
Example: A retail business tracks competitor discounts and adjusts its own prices automatically to stay competitive.
Automation processes customer feedback from surveys, reviews, and support tickets, identifying trends and key concerns.
Example: A SaaS company analyzes customer reviews to identify recurring issues with its software, helping prioritize updates.

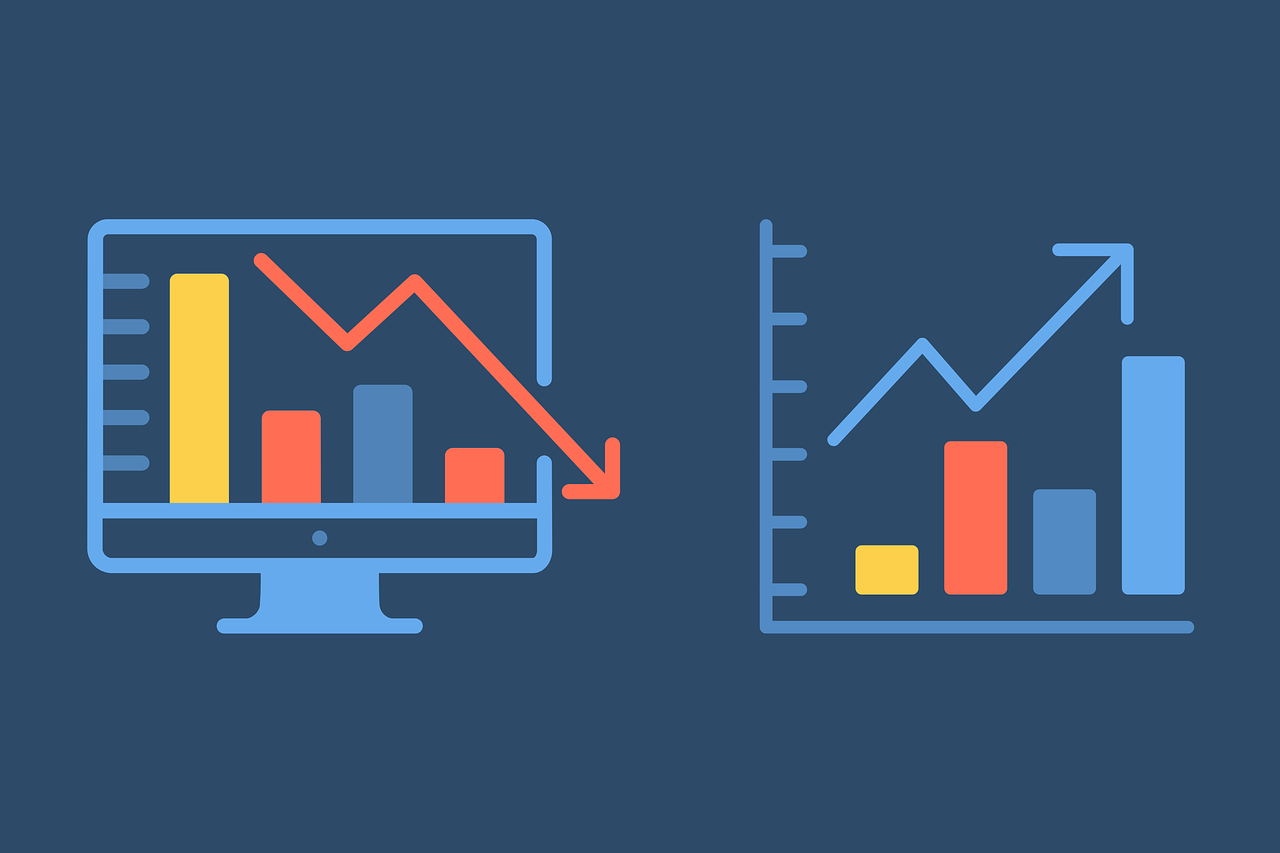
Real-time dashboards provide visual representations of key performance indicators (KPIs), ensuring stakeholders stay informed.
Example: A logistics company uses automated dashboards to track delivery times, fuel costs, and route efficiency, enabling quick adjustments.

Automation generates scheduled reports, summarizing data and key metrics for stakeholders.
Example: A marketing agency sends clients weekly reports on campaign performance, including impressions, clicks, and ROI, without manual input.

Automation identifies trends in industry data, helping businesses stay ahead of the curve.
Example: A food and beverage company tracks emerging ingredient trends in real-time, allowing them to launch products aligned with consumer demand.